Understanding DuPont Pyramid of Ratios
ACCOUNTING


Introduction:
The DuPont Pyramid of Ratios is a powerful financial analysis tool that breaks down a company’s return on equity (ROE) into key components, helping to understand what truly drives profitability.
By linking profitability, efficiency, and leverage ratios in a structured way, the DuPont model provides deeper insights into how management decisions affect overall financial performance.
Why Return on Equity (ROE)?
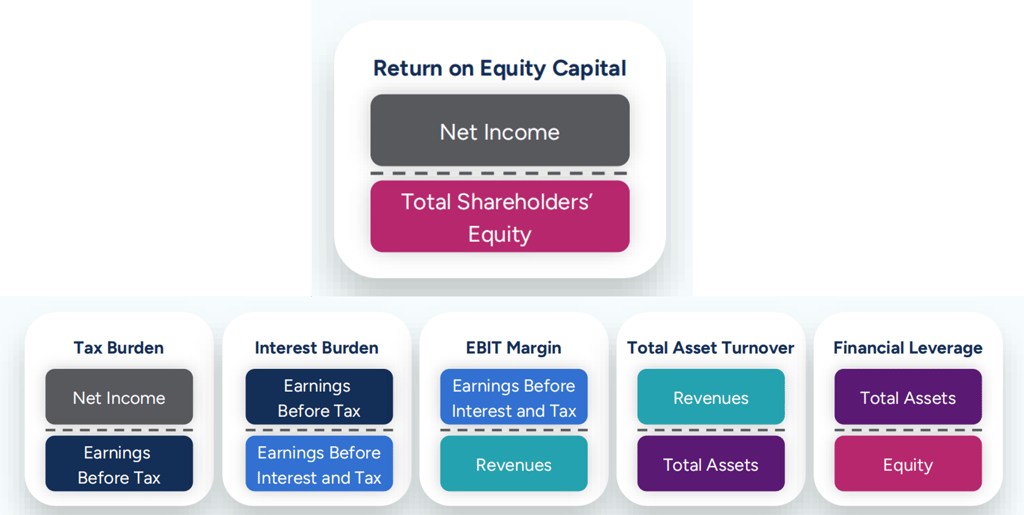
Return on Equity (ROE) was chosen as the starting point because it represents the final outcome for the owners — it shows how much profit the company generates for every dirham (or dollar) invested by shareholders.
In other words, ROE = Net Income / Total Shareholders' Equity = the bottom-line return to investors.
The Five-Lever Breakdown:
The extended DuPont model expresses ROE as:
ROE = (Net Profit / EBT) × (EBT / EBIT) × (EBIT / Sales) × (Sales / Assets) × (Assets / Equity)
Each component represents a critical driver:
Net Profit / EBT (Tax Burden) – shows the effect of income taxes on profit.
EBT / EBIT (Interest Burden) – shows how financing costs (interest expenses) impact earnings.
EBIT / Sales (Operating Margin) – shows operational efficiency and cost management.
Sales / Assets (Asset Turnover) – shows how efficiently assets generate revenue.
Assets / Equity (Equity Multiplier) – shows financial leverage, or how much of the assets are financed by equity versus debt.
Key Takeaway:
The five-lever DuPont analysis is widely used by financial analysts, consultants, and business owners to evaluate trends over time, and identify internal performance drivers.
It transforms financial ratios into actionable insights, making it easier to link strategic decisions to financial outcomes.
Need help apply and model DuPont analysis for your business? Contact Assure Gate Tax & Accounts for expert guidance tailored to your business.